Dimensions of a battery
Being in the storage industry as an early disruptor means growing it. What does this entail exactly? As a specialist for battery optimization, enspired consults with companies that want to use their flexibility to make a valuable contribution to the energy transition. From these companies, we learn about the projects they intend to bring to the market and the challenges they face on this journey, including warranty terms and battery dimensions. Two of the most pressing questions we get asked are:
- What is the impact of battery sizing and cycles on the revenue capture in the markets?
- How much will the asset degrade?
This article has the answers, complete with examples and illustrations.
Warranty terms and the impact of cycles on cross-market revenue
Revenue capture with cycles
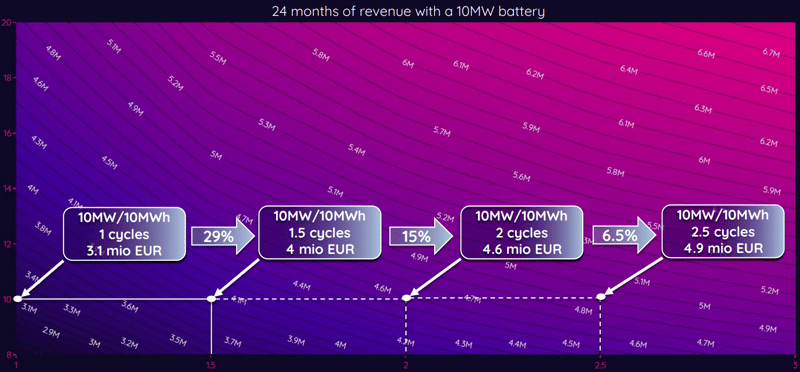
The chart shows a 24-month duration for a 10 MW / 1-hr battery. In simpler terms, this is an asset with a storage capacity of 10 MW, which upon discharge would be depleted in approximately 1 hour. Keeping in mind this configuration and presupposing 2021-2022 market conditions in Germany, we are capturing roughly € 3.1 million for 1 cycle. Increasing the cycle rates to 1.5 equates to an additional 29% of revenue capture, up to 4 million. As you would expect, it keeps going up as you increase the cycles. 2 cycles come with a plus of 15%, to 4.6 million, and 2.5 cycles bring it up by an additional 6.5%, to 4.9 million.
Evidently, more revenue is captured as cycles increase, but the graph also shows that the growth is not linear. It phases out even with more cycles. For this reason, we at enspired say there is a sweet spot for cycle rates: 2 per day. And we are starting to see some of that on the warranty terms now. There are specs for the annual average of 2 cycles per day, and sometimes they give the option to increase that to 4 cycles.
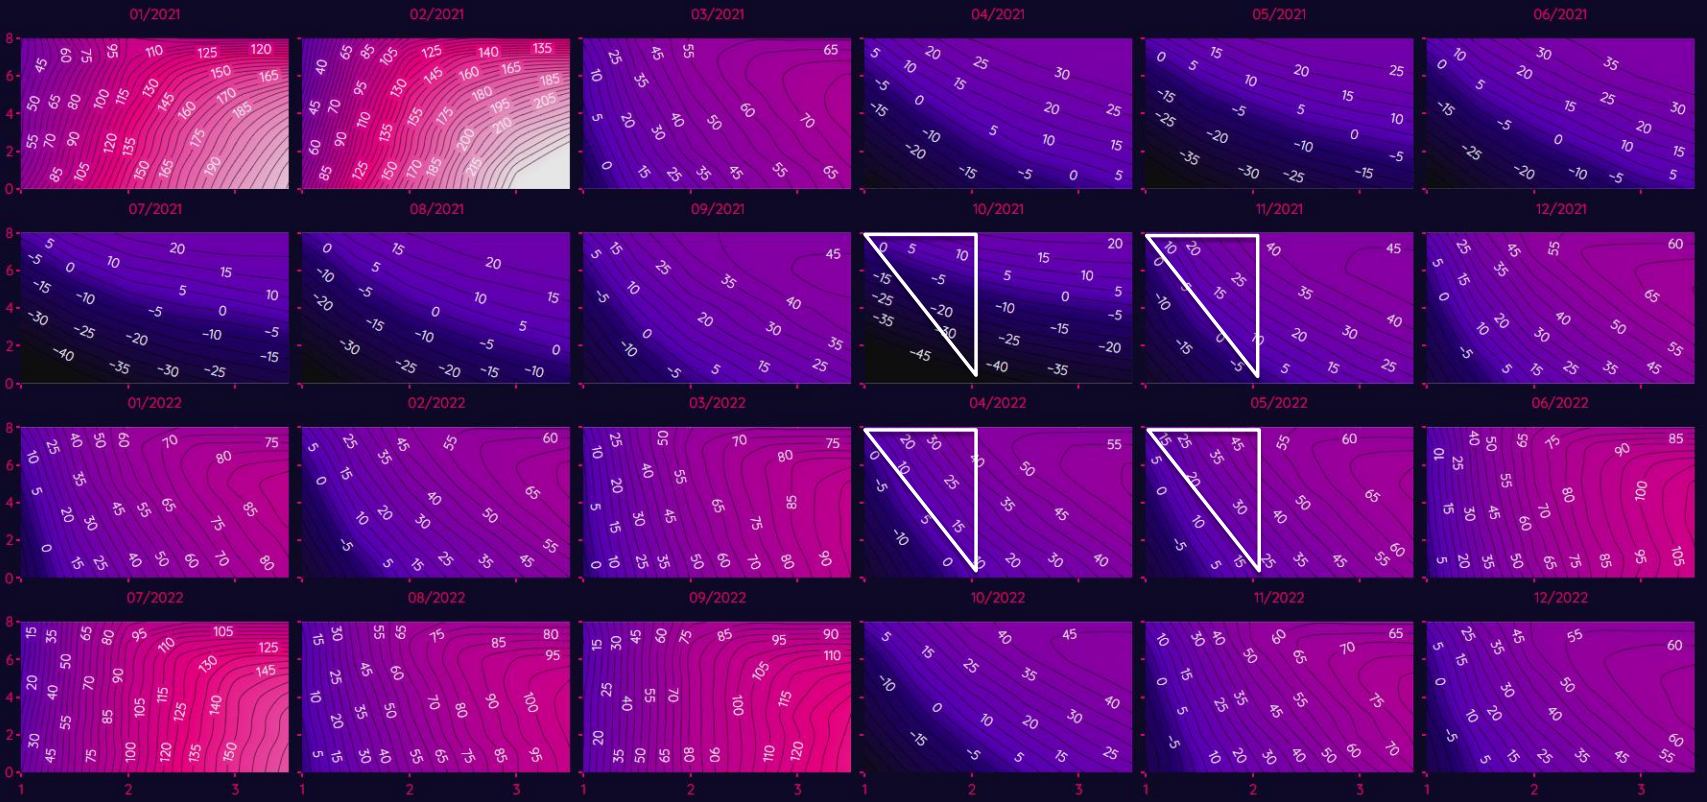
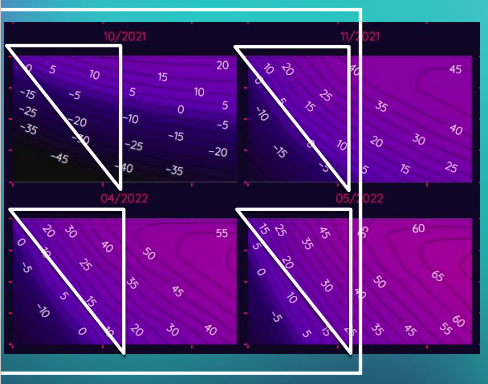
Chart #2 depicts monthly spreads, with the triangular illustrations clearly showing percentage increases of up to 50%. This is the market impact 2 cycles can have. Through upcycling, more options to combine and stack revenue streams become accessible to you.
Generally, we say that 2 cycles are a good choice for your asset even if we are not running 2 cycles every day. Still, having 2 cycles available to capture market opportunities is the best way forward. It gives you more options to combine, stack and optimize the revenues for wholesale, aFRR (automatic Frequency Restoration Reserve) and FCR (Frequency Containment Reserve).

Packing heat: batteries and temperature
Additional noteworthy factors that influence cycles are temperature (don’t let poor air conditioning limit your revenues!) and annual throughput (must match the number of cycles and MWhs), both of which are often backdoor restrictions in warranty terms. There is no point in having a theoretical availability of capacity if you have to let your 2-cycle battery sit idle to cool back down to permissible temperatures for two hours after one cycle of use. That is why we advise you to invest in a good HVAC system.
When to charge and discharge a battery
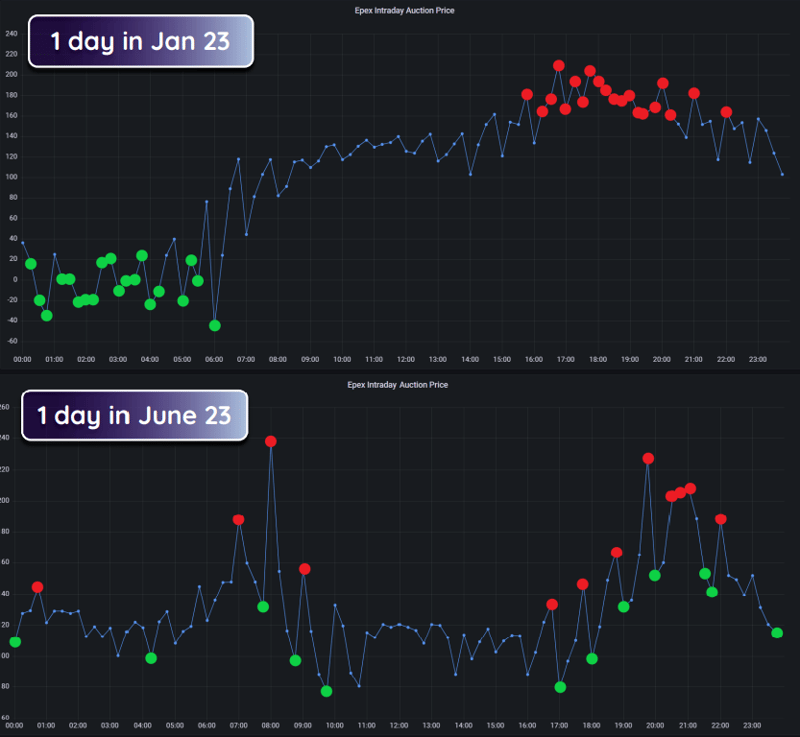
Now, let’s also bring duration into the equation. Cycles and duration are a very important topic – they go hand in hand. What you’re seeing here are two intraday snapshots, one from January and one from June 2023. January here really emphasizes the importance of duration. The green dots are where you would ideally start charging your asset, while the red dots are where you would discharge it. By following this pattern, you take advantage of the early morning prices when charging and of the evening peaks when discharging. While cycle requirements are kept to a minimum in this example – the graph shows only 1 cycle – duration really does come into play here. As you can see, a 5-hour duration system would be ideal to capture all the market value. This works well for pumped storage, but no such thing exists for batteries at the moment. The good news is you can still capture a lot of that market value with a 2-hour duration. Looking at six months later in June, the intraday scenario is much better suited for cycle rates. In this case, 2 cycles will capture the entire market value, while duration is completely irrelevant.
Summing up the graphs for duration
- no big deltas between quarter hours
- buying in the morning and selling in the evening
Summing up the graphs for cycles
- in the morning and evening more than 4 quarter hours to charge and discharge -> 2 cycles +
- cycles are important, but the duration is not that relevant
What is more important, cycles or duration?
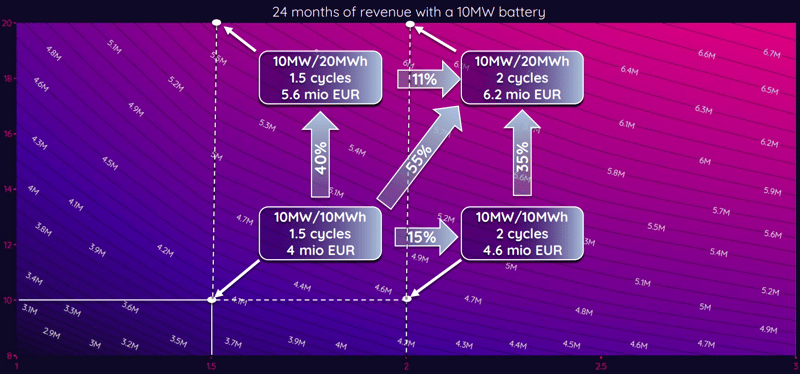
Let’s revisit our earlier chart with duration added to it. The new chart now shows you different optimization strategies. For 1.5 cycles over the course of 24 months with a 10 MW / 10 MWh battery, you are catching a revenue of € 4 million. Doubling the duration to 10 MW / 20 MWh will not double revenue, but it will give you an increase of 40% to € 5.6 million. Long story short, the maximum is reached when you increase duration and cycles. A 10 MW / 20 MWh asset with 2 cycles will increase the revenue capture by 55% to € 6.2 million.
All in all, duration should be considered for battery configuration, especially if you want to access aFRR for more marketing opportunities. A 2-cycle 2-hour-duration asset is going to give you the best return on your investment. We call this approach (good) design for revenue.
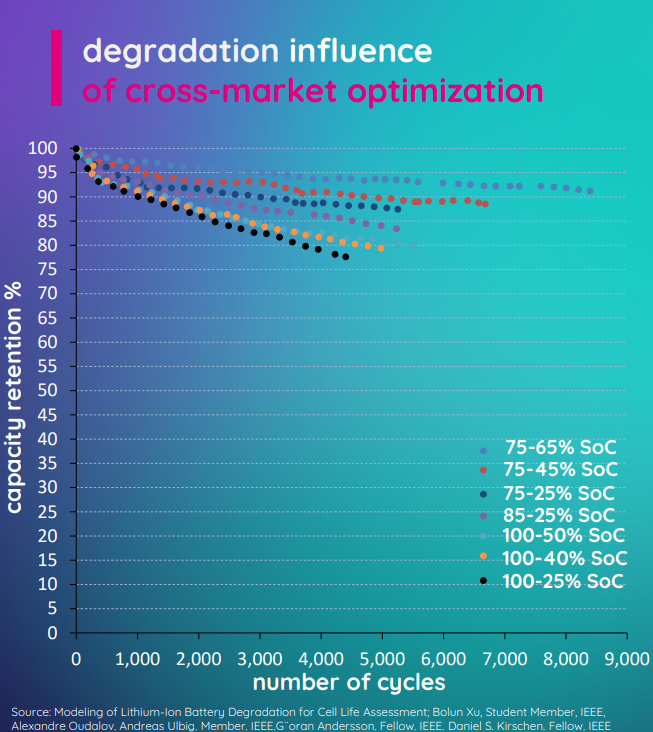
Battery degradation
Degradation is a very important topic for the lifetime and ROI (Return on Investment) of a battery. Longer duration gives you the freedom to market the asset in a preferred SOC (State of Charge) range. Together with clients, we work on finding this optimal range to maximize revenues while keeping the battery healthy. This allows us to adapt trading strategies to limit degradation and optimize the SoH (State of Health). In the chart below, you can identify the battery’s capacity retention. If we run 7,000 cycles with a preferred SoC range of 75-25%, the asset retains a capacity of 90%.
Battery size: the key takeaways
Duration & cycles
2-hour batteries with 2 cycles
- give you flexibility in establishing revenue streams
- bring more freedom to optimization strategies
- make your battery future-proof by keeping it healthy
Degradation
Asset degradation is kept low by
- running backtests with asset-specific data and insights
- optimizing the battery across all relevant markets
- considering battery health in the optimization strategies
- cooperating closely and transparently with the client
Warranty
For your battery warranty, make sure that
- terms are coherent in themselves
- cycles are useable
- throughput is not a backdoor restriction
- money is not saved in the wrong place (e.g. air conditioning)