Portfolio performance in the context of market developments
Portfolio performance is the independently confirmed revenue achieved by an optimizer through cross-market battery optimization. It is the only metric showing real BESS revenues. The data provides key insights into market trends and revenue dynamics, bringing clarity to how market conditions shape commercial outcomes. In a push for more transparency in the industry, enspired decided to make this information publicly accessible and remains the only optimizer to have done so. Results will be updated regularly as new certifications become available.
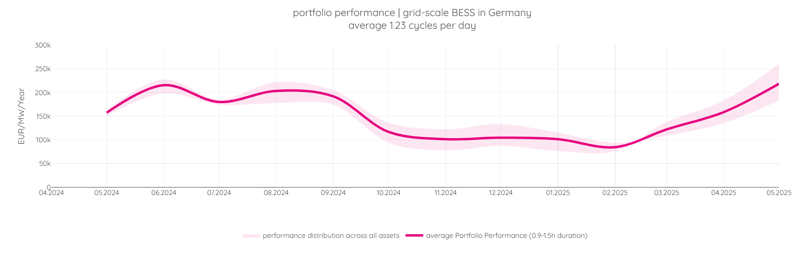
The charts below represent enspired's portfolio performance. They show revenues for grid-scale BESS projects with a 0.9-1.5-hour duration, located in Germany, optimized across all revenue streams (wholesales, FCR, and aFRR). The underlying figures are also part of the report in which they were subject to independent limited assurance by Austrian Chartered Accountant KPMG Austria GmbH.
April-May 2025
Revenue trends and market outlook
Between April and May 2025, the Central European electricity market saw favorable conditions for battery optimization with deeper renewable penetration, softened demand, and widening price signals across timeframes. Accordingly, we observed a notable leap in portfolio performance.
- Our <1.5-hour duration BESS portfolio in Germany achieved the highest performance since the onset of the energy crisis in 2022, recording an annualized revenue of € 218,575/MW with an average of 1.37 daily cycles for May.
- The best-performing battery unit achieved a stunning result of € 261,137/MW/Year.
- Portfolio performance increased by 38% compared to the previous month and by 39% compared to May 2024.
Day-ahead and intraday markets
- Day-ahead prices in Germany decreased by 13.6%, while price volatility and frequency of negative price events went up, driven by rising solar and wind output during low-demand periods.
- In May, arbitrage opportunities in the intraday continuous market offered more volatile and profitable spreads than in April, in particular for batteries leveraging short-term price dislocations.
Ancillary services and balancing markets
Despite a drop in real-time imbalance events (from three spikes to one), FCR and aFRR capacity prices surged across the board:
- FCR: +30% average increase
- aFRR-up: +33%
- aFRR down: +64%
- Price peaks exceeded € 100/MWh, especially on the downward side
This environment rewarded batteries providing reserve capacity, showing the value of stacking strategies that combine energy and capacity market participation.
Extreme price events
- Imbalance price spikes decreased from three events in April to only one in May, which suggests improved grid stability and highlights the importance of capacity market participation even when real-time imbalance volatility is reduced.
aFRR energy products
- May prices averaged nearly € 90/MWh and peaked at over € 7,300/MWh.
- Batteries responding to fast-moving imbalance needs were able to capture significant revenue.
Residual load and renewables
- Solar output rose by 11% and wind by 36%, leading to renewable-saturated supply conditions.
- At the same time, system load dropped by 4%, with deeper overnight lows and fewer peak swings.
- The convergence of high supply and low demand scenarios intensified the need for flexible, fast-response storage capabilities to balance the system without costly interventions.
Outlook
Continued strong solar output (average 14.7 GW, peaks near 49 GW) combined with steady wind generation in June will likely lead to more overlapping renewable surges within the same day, reinforcing downward pressure on aFRR energy prices, especially for downward products.
Intraday volatility could stay elevated as batteries respond to solar ramp-downs and intermittent wind patterns, creating valuable arbitrage windows.
March-April 2025
Revenue trends and market outlook
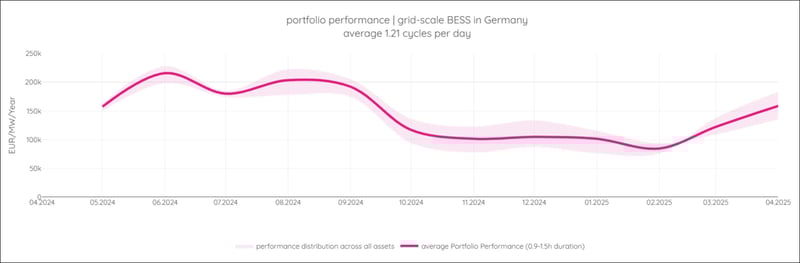
- With 2025 already off to a sunny start as March drew to a close, April picked up where March ended. Plenty of sun for the first two weeks, layered with windy days, before solar stepped up and set a yearly record high.
- As with March, April is classified as a shoulder month where influences like temperature or solar ramps are still present but not as extreme. However, 2025 is proving these shoulder months can deliver remarkable trading opportunities, driven by dynamic renewable patterns and price spreads.
- Average portfolio performance in April 2025 (€158k/MW-annualised) outperformed April 2024 by 11%, with a 30% increase from March 2025.
Day-ahead market
- Average prices dropped again month by month as negative prices begin to weigh heavily across daily averages.
- Renewable pressure on low demand days (e.g. public holidays, weekends) creates new lows – April 27 hit -€249/MWh, the sharpest intraday drop so far this year.
- Peaks were lower, but average daily spreads were up 10%.
Intraday market
- Average spreads in intraday auctions stepped up in April, offering on average almost €300/MWh.
- Sunnier days offered wider spreads as surplus generation hit the market.
Extreme price events
- April 5-6 and April 26-27: Sunny weather across Europe drove midday prices well into negative territory.
- March 19 – low wind and high wind saw another significant impact of the solar ramp-down, not as unexpected as March 6, but impact was still felt in the markets.
- April 29: The Spanish blackout caused a notable shift in the German market on the 30th, although direct impact was limited.
Balancing markets
- April FCR prices took another step up, averaging over €20. This follows the trend highlighted in March, where the marginal cost of gas layered into bid prices.
- As midday prices turn negative, a premium is added to FCR; the pay-as-clear mechanism pushes FCR higher.
- Both aFRR up and aFRR down capacity prices stepped up, with the down product seeing a larger increase.
aFRR energy products
- Despite rising capacity prices, energy activations continued their downward price trend in April, reflecting high bid competition and frequent availability of cheap renewable surplus.
- Downward products were particularly impacted as solar dominance increased, leading to a larger share of activations during midday negative pricing windows.
- April saw a higher number of activated hours, especially for aFRR down, as solar volatility during the day and ramp-downs in the evening required frequent balancing.
- This signals an increasing reliance on flexibility during intraday swings, even in shoulder months.
Residual load and renewables
- Solar generation jumped from 6.5 TWh in March to 8.5 TWh in April. Comparably, wind dropped from 8.3 TWh to 6.9 TWh.
- Solar in Germany set new yearly highs at over 46 GW for several days in the month, meeting over 80% of demand at that time and 75% of peak demand.
- Residual load, or the measure of demand satisfied by renewable generation, was highest mid-month and lowest during the period mentioned above, where residential load trended towards 0, meaning demand was completely satisfied by renewables.
Outlook
- Looking ahead, if solar and wind continue to overlap intraday, we expect further downward pressure on aFRR energy prices.
- Rising capacity values may continue, especially if gas-based generators remain marginal in the FCR stack.
February-March 2025
Revenue trends and market outlook
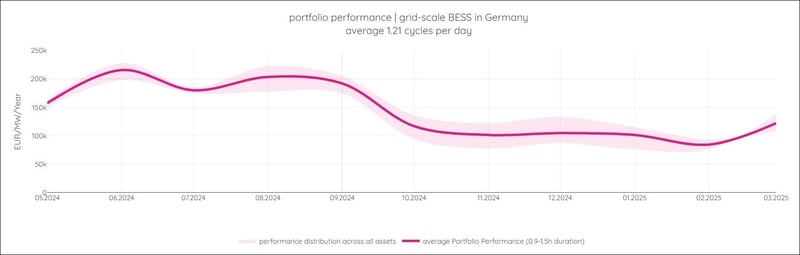
- With the dark days of February over, March brought brighter weather and with it the highest revenue of the year so far. aFRR capacity trends went up as more solar hit the grid, with the final weeks in March particularly sunny across the continent, perhaps an indicator for the summer to come.
- March is still classified as a shoulder month where influences like temperature or solar ramps are still present but not as extreme.
- Despite this trend, average portfolio performance in March 2025 outperformed March 2024 by 23%, continuing the trend enspired set last month with annual increases.
Day-ahead market
- Average prices dropped into March as renewables pushed the lower side down with the lowest price hitting €60/MWh. Peak prices were around 5% lower.
Intraday market
- Intraday prices on average were lower; however, peak prices in auctions set new highs, with spreads of over €1,500/MWh on some days as the solar ramp down aligned with drops in wind, leaving the system short.
Extreme price events
- March 6 – large imbalance in the evening as solar ramped down and wind fell short of forecast.
- March 19 – low wind and high wind saw another significant impact of the solar ramp down, not as unexpected as March 6, but impact was still felt in the markets.
Balancing markets
- March FCR prices were much higher on average than in both January and February, averaging €13.7 as the result of higher renewables increasing the marginal cost of conventional generation on the system.
- Similar to FCR, aFRR capacity down almost doubled as surplus generation put pressure on the grid. Up capacity almost halved in value, acting on the opposite drivers.
- Over the month, a split of 70% aFRR up would have yielded the highest revenue dropping from over 80% the month before.
aFRR energy products
- March saw more volatility than February, driven mostly by the demand for downward products.
- Both the start and end of the month saw the most volatility with the impact of solar (start) and wind (end).
Residual load and renewables
- The period from 18-23 of March saw both monthly highs of solar and wind, both peaking at over 45 GW and 40 GW, respectively.
- Residual load, or the measure of demand satisfied by renewable generation, was highest mid-month and lowest during the period mentioned above, where residential load trended towards 0, meaning demand was completely satisfied by renewables.
January-February 2025
Revenue trends and market outlook
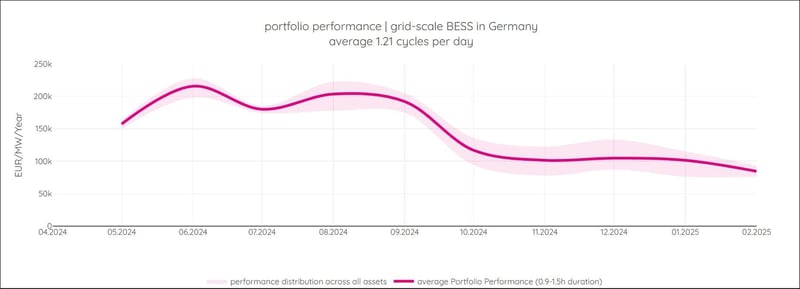
- The downward trend in revenues reflects broader market conditions, as confirmed by several index providers.
- Despite this trend, February outperformed 2024, setting a solid foundation for the rest of 2025.
Day-ahead market
- While average prices were higher in February, the spread of DA prices was 10% lower, indicating reduced volatility.
Intraday market
- ID1 spreads fell 43%, following the same trend of lower volatility, despite higher average prices in February.
Extreme price events
- January 20-21 recorded the widest wholesale spreads at €780/MWh from day-ahead; the next day intraday offered just under €900/MWh.
- February’s highest spread was significantly lower with the highest day-ahead price hitting just under €370/MWh, and the spread across both markets peaking at the same level for a single cycle trade.
Balancing markets
- February FCR prices were marginally lower on average than in January 2025.
- aFRR capacity prices were higher in February than in January, largely due to increased solar generation towards the end of the month.
aFRR energy products
- January saw greater price volatility, with frequent spikes in both up and down products.
- The middle of January experienced particularly high down-prices, followed by an increase in up-prices the week after.
- February had less volatility, with the lowest fluctuations occurring during the winter half-term break (Feb 17-21).
- Notably, February 18 recorded the lowest down-price (€301/MWh) and highest up-price (€1,140/MWh).
Residual load and renewables
- Residual load (the measure of demand satisfied by renewable generation) was highest on January 6, the second highest of the year (after January 1).
- Mid-to-late January saw similar conditions, but from then on, renewables played a more consistent role.
- By February, solar peaks covered almost all demand on several days, significantly reducing system stress.
For more information on portfolio performance calculations, you can download corresponding reports. Please note that revenue certification typically occurs with a month's delay, as it includes essential ancillary service data from the TSO, which can take up to 6 weeks. The numbers presented in the portfolio performance chart are factual revenues made by enspired. Due to verification and auditing processes, approval by KPMG Austria becomes available within a month of publishing the results.
What do market movements and portfolio performance mean for your BESS?