battery storage
Cross-market battery optimization
How to secure and diversify BESS revenues by allocating available capacity strategically across wholesale, FCR, and aFRR.
In a new era of optimization, we market batteries for maximum revenue with minimum degradation through cell-specific dispatch profiles.

What if you could achieve peak revenue levels while extending the life of your BESS (battery energy storage system)? Our breakthrough optimization strategy brings the best of both worlds to asset owners: maximum revenue with minimum degradation resulting in maximum profitability. Successful BESS monetization is a question of technology and data. With adaptability and speed, you outperform industry benchmarks. Integrating all revenue streams and near real-time dynamic capacity allocation were two such steps we took early on. Including battery degradation now adds another layer of precision that allows us to not only maximize revenues but also to identify the dispatch patterns best suited to ensure the longevity and value of your asset.
To get the terminology out of the way, the following can all be used to refer to the new practice of degradation-informed participation in the power markets:
They all stress that cell-specific degradation behavior is considered in the optimization to achieve the longest possible lifespan for the highest possible revenue. For comparison, the current approach targets revenue maximization across wholesale, FCR, aFRR energy, and aFRR capacity within warranty terms. Maxing out the available warranty terms (cycles, DoD – depth of discharge, etc.) means an asset degrades according to plan (as laid out in the degradation information). If your battery has an availability of 550 cycles per year–assuming a linear model–the optimization aims to use them, resulting in a gradual loss of capacity.
The optimization faces a problem with the annual throughput budget, as unused cycles cannot be carried over. A total cycling budget related to degradation would be much smarter, as it allows optimization throughout the asset’s lifetime and adaptation to fundamental changes in the power market. What we are observing in the market is that warranty terms are becoming more flexible, and this flexibility complements the new optimization approach.
By taking into account asset-specific degradation information, the battery suffers less, stays healthier, and lives longer. Due to more available capacity in later years, the asset can generate higher revenues over time, increasing its terminal value. This sounds like a no-brainer, so why isn’t everybody including battery degradation models to maximize profitability? Because it is incredibly complex, requires a ton of data, and employs lightning-fast model training.
Let us take a closer look. As we have learned, optimizing for profit achieves maximum revenue while simultaneously prolonging the asset’s operational lifetime. But how does this work? Rather than simply complying with technical requirements, degradation costs are integrated into the optimization strategy. This is easier said than done as batteries have a wide range of different cell types, and these cell types behave very differently from one another.
Generally, there are two main lithium-ion cell types in standalone grid-scale battery storage: LFP, short for lithium iron phosphate (LiFePO4), and NMC (NiMnCo)O2, short for nickel manganese cobalt. Both are rechargeable, offer flexibility in the design, and come with a broad range of industrial applications. LFP stands out for superior safety, longer lifetime, lower cost, better performance in extreme temperatures, and greater sustainability. NMC, on the other hand, exhibits higher energy density and better performance in standard conditions.
| LFP battery cells | NMC battery cells | |
| energy density | lower | higher |
| safety | higher | lower |
| lifetime | higher | lower |
| sustainability | higher | lower |
| cost | lower | higher |
| performance in standard conditions | lower | higher |
| performance in extreme conditions (hot/cold) | higher | lower |
| design flexibility | same | same |
In degradation-informed optimization, it is not as simple as differentiating between LFP and NMC, as the characteristics of the same cell type vary from manufacturer to manufacturer and even within the same manufacturer. Two separate LFP cells can exhibit completely opposite degradation patterns when (dis)charging in the same SoC (State of Charge) range. While LFP cell 1 may degrade only minorly in an SoC range from 10-50%, SPF cell 2 might operate poorly in this configuration and perform best between 40-70%. You can cycle a battery in different SoC ranges, but since cell manufacturers do not know in which SoC range a battery will be marketed, they stipulate the warranty conditions rather conservatively to accommodate all marketing scenarios.
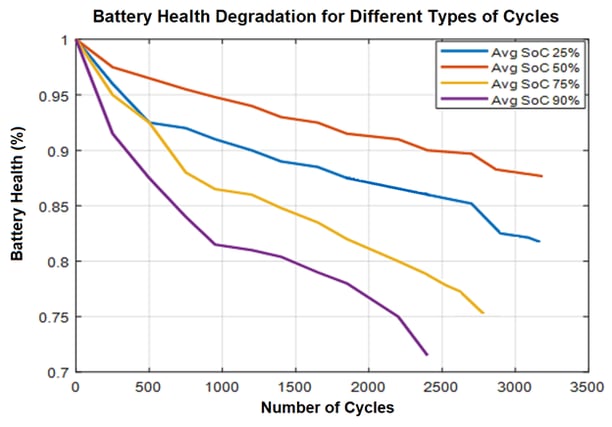
Modeling of battery health for similar assets after the same cycling procedure with different SoC averages.
Graph source: Storlytics
What does battery degradation look like? This depends heavily on asset configurations. To get a general idea, we can use the graph above for reference. According to context provided by Energy Storage News, the curves depicted in it were derived from accelerated degradation tests for similar lithium batteries, all cycled at a 10% DoD (Depth of Discharge) with differing average SoCs. For the blue line with an average SoC of 25%, this means the batteries were (dis)charged between 20-30% SoC. Orange indicates cycling between 45-55% SoC, yellow between 70-80% SoC, and purple between 85-95% SoC. As you can see, the effects on battery health varied significantly in the sample configurations.
By taking into account such exact degradation information, an asset can be marketed with much greater precision, achieving the same revenue with less wear and tear. The aim is to keep revenues high while treating the battery more efficiently so that the costs associated with degradation are low. Throughout its lifetime, a battery can undergo only a limited number of cycles, but if the (dis)charging processes are managed in an asset-friendly manner, it will live longer and generate more revenue, ultimately driving up profits. In short, degradation-informed optimization increases the lifetime value of your battery.
Warranty terms are drafted according to how a cell functions and behaves, respecting factors such as cycling and throughput. The performance guarantee issued for your asset by the manufacturer (for instance, 80% battery capacity after 10,000 cycles) is subject to compliance with warranty terms. Cell-specific optimization then allows you to retain, say, 90% of capacity after the same cycle count, giving the asset more opportunities to earn money. Every cell type comes with elaborate data sheets in which the manufacturer specifies at which temperature it should be operated and in which SoC range it should be cycled. In asset optimization, you can individualize trading models based on the degradation information of each cell type to ensure asset-sustaining behaviors.
The degradation-informed approach to optimization secures low battery stress levels, which affect the asset’s RTE (Round Trip Efficiency) and, by extension, revenue potential. What is Round Trip Efficiency? Expressed as a percentage, RTE refers to the efficiency with which energy is stored and retrieved from a battery system. It indicates the ratio of the energy released from the battery compared to the energy needed to store it. Here is an example: Let us assume a battery’s RTE is rated at 93% – this means you charge 100 MWh but are only able to release 93 MWh after all the losses on the way. If the battery is under a lot of stress, its RTE decreases. After 5 years of operation, you might be left with an RTE of 80%, which equates to an 80 MWh discharge from a 100 MWh charge. Healthy battery marketing keeps the RTE high by minimizing degradation.
Degradation is often associated solely with SoH (State of Health) even though SoH refers to battery capacity – for example, 80% capacity after 10,000 cycles and 5 years. But that is only half the story since RTE also has a considerable influence on the trading result. If your battery has 80% left of its nominal capacity and an RTE of 80%, it means you charge 80 MWh and have 64 MWh available to discharge. With healthy asset treatment, your BESS might be rated at 90% capacity and 90% RTE instead. Minimizing battery stress levels maximizes your RTE and gives you a major advantage for optimization and commercial success.
Interested in talking about the applicability of this optimization strategy?
Let's talk about your project →
To get more information, our webinar on this topic is available to watch on demand.
How to secure and diversify BESS revenues by allocating available capacity strategically across wholesale, FCR, and aFRR.
Power markets and energy trading in Europe: This reference system details market setups and mechanisms in long- and short-term timeframes.
Are battery revenues in mainland Europe at risk of crashing like they did in Great Britain? As an optimizer, we say no, and here is why.